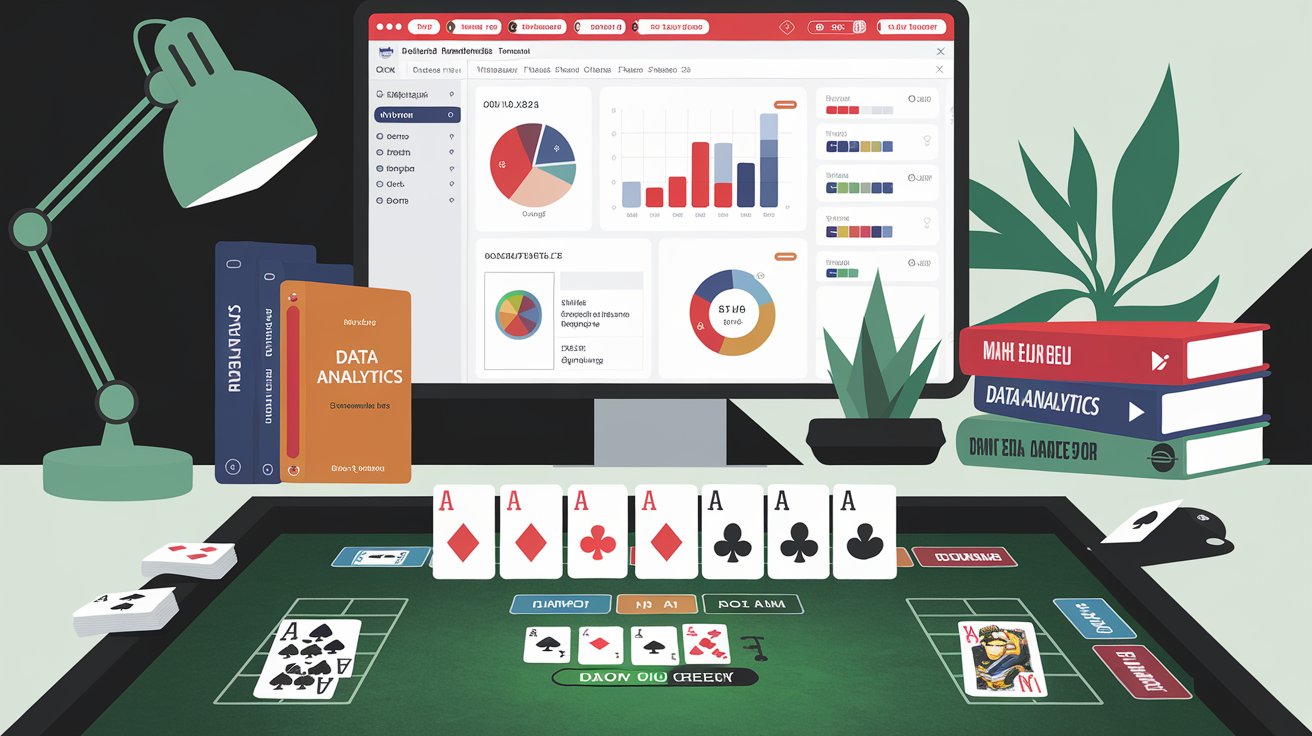
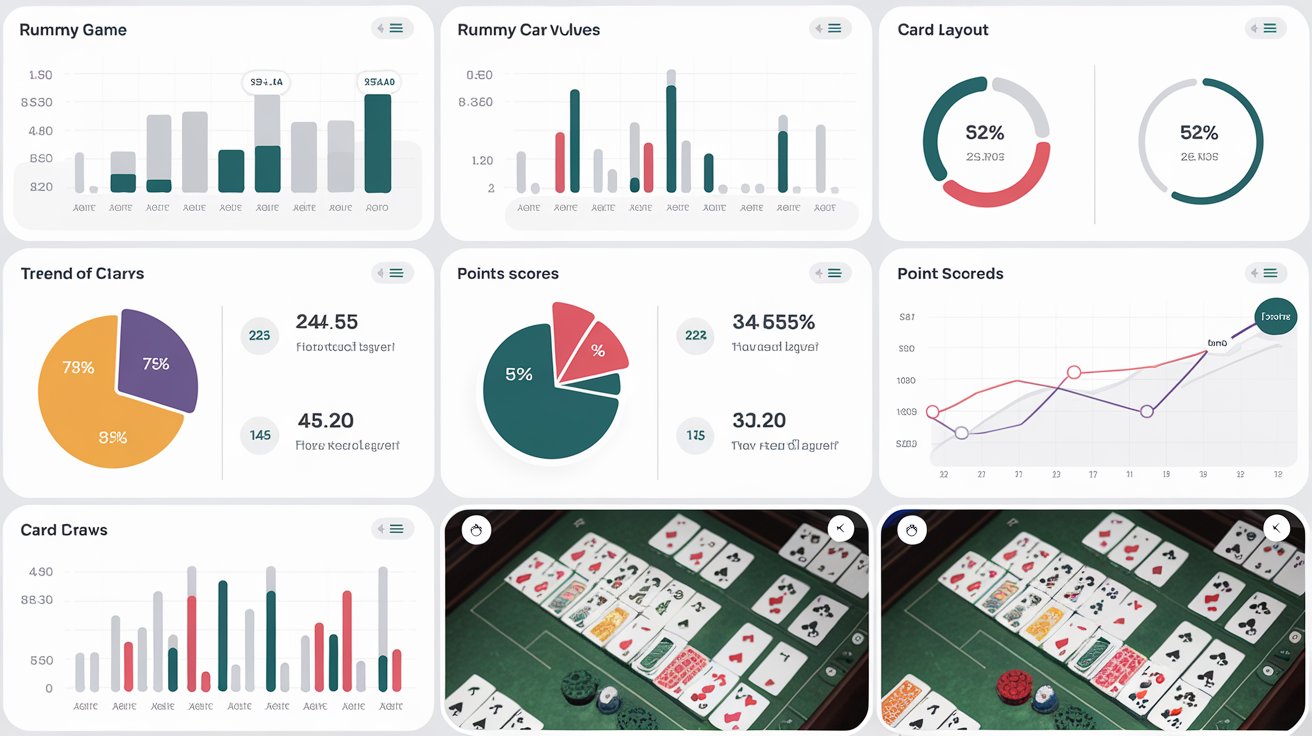
Rummy is more than just a card game—it’s a battle of wits, strategy, and skill. Whether you’re playing casually with friends or competing in online tournaments, the difference between a good player and a great one often comes down to decision-making. But what if there was a way to sharpen those decisions, predict your opponents’ moves, and consistently come out on top? Enter data analytics—a game-changer that’s revolutionizing how players approach rummy. In this blog, we’ll explore how data analytics can elevate your rummy game, offering practical tips, insights, and strategies to help you dominate the table. Let’s dive in!
What Is Data Analytics, and Why Does It Matter in Rummy?
Data analytics is the process of collecting, analyzing, and interpreting data to uncover patterns, trends, and insights. In industries like business, sports, and healthcare, it’s used to optimize performance and predict outcomes. But in rummy? Absolutely! This classic card game, with its mix of skill, probability, and psychology, is a goldmine for data-driven strategies.
When you play rummy—whether it’s Indian Rummy, Gin Rummy, or another variant—every move you make generates data. Which cards do you pick? Which do you discard? How often do you meld? By analyzing this information, you can refine your gameplay, spot weaknesses, and exploit your opponents’ habits. The best part? You don’t need to be a math genius or tech wizard to use data analytics—just a willingness to learn and adapt.
How Data Analytics Enhances Your Rummy Skills

Rummy isn’t just about luck; it’s about making informed choices under pressure. Here’s how data analytics can transform your game:
1. Understanding Probabilities and Card Distribution
At its core, rummy is a game of probabilities. With a standard deck of 52 cards (or two decks in some variants), there’s a finite number of possibilities for what’s in your hand, the discard pile, or your opponents’ possession. Data analytics helps you calculate these odds with precision.
For example:
- If you’re waiting for a Queen of Spades to complete a set, analytics can estimate the likelihood based on cards already played or discarded.
- Tracking the discard pile over multiple games reveals patterns—like how often certain cards (e.g., high-value cards like Kings or Aces) get tossed early.
By mastering these probabilities, you can decide whether to hold onto a card or discard it, maximizing your chances of forming a winning hand.
2. Spotting Opponent Patterns
Your opponents aren’t random—they’re human (or sometimes AI bots), and they have tendencies. Data analytics lets you track their moves over time. Do they always discard low-value cards first? Are they quick to pick from the open pile? Do they hesitate when forming sequences?
In online rummy platforms, where you might face the same players repeatedly, keeping a mental or digital log of their habits can give you an edge. For instance:
- If Player A discards face cards early, they might prioritize sequences over sets.
- If Player B frequently picks from the discard pile, they’re likely close to completing a meld.
With this data, you can adjust your strategy—holding onto cards they need or baiting them with discards they’ll regret picking.
3. Optimizing Your Own Gameplay
Self-analysis is just as critical. Data analytics helps you evaluate your own performance:
- How often do you win when you draw from the stock pile versus the discard pile?
- Are you holding onto high-point cards too long, risking a big loss if someone declares?
- What’s your average time to meld in a game?
By reviewing your stats (many online rummy apps provide this data), you can identify inefficiencies and tweak your approach. Maybe you’re too cautious with discards, or perhaps you’re not aggressive enough in forming pure sequences early. Data shines a light on these blind spots.
4. Managing Risk and Reward
Every rummy move carries risk. Should you discard a 10 of Hearts that could help an opponent, or keep it in hopes of completing a set? Data analytics quantifies these risks by analyzing past outcomes. Over time, you’ll develop a sense of which moves yield the highest rewards versus those that backfire.
For example, if data shows you lose more points holding onto high-value cards late in the game, you might shift to a more conservative discard strategy. It’s all about balancing risk and reward—a skill data analytics hones to perfection.
Tools and Techniques for Applying Data Analytics to Rummy

You don’t need a supercomputer to start using data analytics in rummy. Here are some practical tools and methods to get you started:
1. Manual Tracking
For offline games, keep a notebook or spreadsheet. Record:
- Cards you draw and discard each turn.
- Opponents’ discards and picks (as visible).
- Game outcomes (win/loss, points scored).
Over a dozen games, patterns will emerge. Maybe you notice you win 70% of games when you prioritize sequences early—valuable insight!
2. Online Rummy Platforms
Most digital rummy apps—like Junglee Rummy, RummyCircle, or Ace2Three—offer built-in stats. After each game, check your performance metrics:
- Win rate.
- Average points per game.
- Time to declare.
Some platforms even provide heatmaps of card usage, showing which cards are most commonly discarded or retained.
3. Probability Calculators
Free online tools or mobile apps can calculate rummy odds in real-time. Input the cards you’ve seen (in your hand, the discard pile, etc.), and they’ll estimate the probability of drawing what you need. It’s like having a math tutor at the table!
4. Learning from Pros
Watch top players on YouTube or Twitch and analyze their moves. Break down their decisions frame-by-frame: Why did they discard that Jack? What prompted that meld? Pair this with your own data to emulate their success.
Real-Life Examples: Data Analytics in Action

Let’s see how data analytics plays out in a rummy game with a hypothetical scenario:
Scenario: Mid-Game Decision
- Your Hand: 4♠, 5♠, 7♠, 9♥, 10♥, K♣, Q♦.
- Discard Pile: 6♠ (top card), J♥, 3♣.
- Stock Pile: Unknown.
You need one card for a pure sequence (4♠, 5♠, 6♠ or 5♠, 6♠, 7♠). Do you pick the 6♠ from the discard pile or draw from the stock?
Without Analytics
You might pick the 6♠ because it’s right there, completing your sequence. But what if an opponent needs it too? You’ve just handed them a clue about your hand.
With Analytics
- Past data shows opponents pick from the discard pile 60% of the time when it’s a mid-value card like 6♠.
- You’ve discarded high cards (e.g., K♣) in prior turns, signaling you’re not chasing sets.
- The stock pile has ~30 cards left, and only 1 other 6 remains unaccounted for (assuming a single deck).
Decision: Draw from the stock. The odds of pulling a 6 or 7 are slim, but it keeps your strategy hidden, reducing the risk of tipping off opponents.
This calculated move, backed by data, could be the difference between winning and losing.
The Psychology of Data-Driven Rummy
Data analytics isn’t just about numbers—it’s about understanding human behavior. Rummy is a psychological game as much as a strategic one. By analyzing data, you can:
- Bluff Smarter: Discard a card you don’t need but that looks tempting, luring opponents into a trap.
- Predict Declarations: If an opponent’s discards suddenly get erratic, data might suggest they’re close to going out.
- Stay Calm: Knowing the odds reduces panic, letting you play with confidence.
Think of data as your secret weapon—it gives you the upper hand without opponents even realizing it.
Challenges of Using Data Analytics in Rummy
While powerful, data analytics isn’t foolproof. Here are some hurdles to watch for:
- Sample Size: You need enough games to spot reliable patterns—five rounds won’t cut it.
- Adaptability: Opponents change tactics. If you rely too heavily on old data, you might miss their evolution.
- Time: Analyzing data mid-game (especially offline) can slow you down, so practice quick mental calculations.
The key? Start small, focus on one aspect (like discard habits), and build from there.
How to Get Started Today
Ready to level up your rummy game with data analytics? Follow these steps:
- Pick Your Platform: Play on an app with stats tracking or start a manual log.
- Set a Goal: Decide what to analyze first—your win rate, discard efficiency, etc.
- Play and Record: Aim for 20-30 games to gather meaningful data.
- Review and Adjust: Look for trends and tweak your strategy accordingly.
- Repeat: Analytics is an ongoing process—keep refining as you go.
Conclusion: Master Rummy with the Power of Data
Rummy has always been a game of skill, but data analytics takes it to the next level. By leveraging probabilities, tracking patterns, and optimizing your decisions, you can transform from an average player into a rummy maestro. Whether you’re aiming to impress friends or dominate online leaderboards, the numbers don’t lie—data is your ace in the hole.
So, shuffle the deck, deal the cards, and start analyzing. Your next winning hand is just a data point away!

Zareb Saleh is a journalist at Gulf Today and a ghostwriter for Gameoholic, specializing in gaming, technology, and digital culture. With a keen eye for industry trends, he delivers insightful stories that engage and inform readers.


